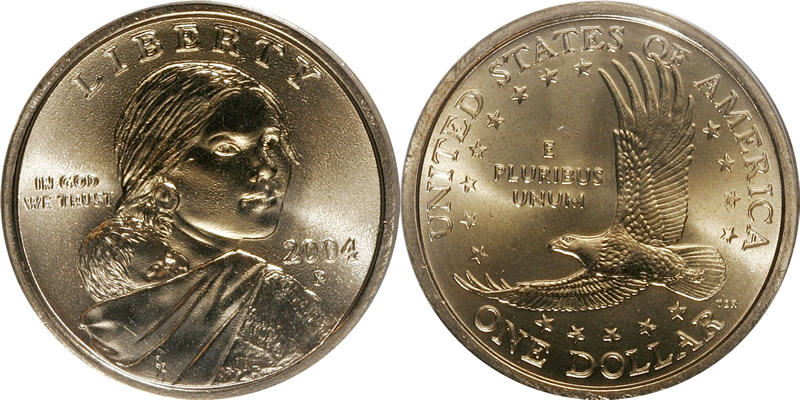
Eagle Reverse (2000 - 2008) |
Weight: 8.1 grams
Content: Cladding: 77% copper 12% zinc 7% manganese 4% nickel, Core: 100% copper
Diameter: 26.5 millimeters
2000 - 2008: Below the date on the obverse.
2009 - Present: On the edge along with the year.
P - 1980 and after Philadelphia 1793-present
D Denver, CO 1906-present
S San Francisco, CA 1854-1955; 1968-present
W West Point, NY 1976-present

| Year | Circulation | Proofs |
| 2000 P | 767,140,000 | 0 |
| 2000 P Goodacre Presentation Finish | 5,000 | 0 |
| 2000 D | 518,916,000 | 0 |
| 2000 S | 0 | 3,082,483 |
| 2000 W | 39 of these coins were struck in 22K gold. 27 of them were melted and the remaining 12 were never released. | |
| 2001 P | 62,468,000 | 0 |
| 2001 D | 70,939,500 | 0 |
| 2001 S | 0 | 2,294,043 |
| 2002 P | 3,865,610 | 0 |
| 2002 D | 3,732,000 | 0 |
| 2002 S | 0 | 2,277,720 |
| 2003 P | 3,080,000 | 0 |
| 2003 D | 3,080,000 | 0 |
| 2003 S | 0 | 3,298,439 |
| 2004 P | 2,660,000 | 0 |
| 2004 D | 2,660,000 | 0 |
| 2004 S | 0 | 2,992,069 |
| 2005 P | 2,520,000 | 0 |
| 2005 D | 2,520,000 | 0 |
| 2005 S | 0 | 3,273,000 |
| 2006 P | 4,900,000 | 0 |
| 2006 D | 2,800,000 | 0 |
| 2006 S | 0 | 3,054,436 |
| 2007 P | 3,640,000 | 0 |
| 2007 D | 3,920,000 | 0 |
| 2007 S | 0 | 2,259,847 |
| 2008 P | 1,820,000 | 0 |
| 2008 D | 1,820,000 | 0 |
| 2008 S | 0 | 1,998,108 |
Yearly Reverses |
Content: Cladding: 77% copper 12% zinc 7% manganese 4% nickel. Core: 100% copper
| Year | Circulation | Proofs |
| 2009 P Spread of Three Sisters | 37,380,000 | 0 |
| 2009 D Spread of Three Sisters | 33,880,000 | 0 |
| 2009 S Spread of Three Sisters | 0 | 2,179,867 |
| 2010 P Hiawatha Belt | 32,060,000 | 0 |
| 2010 D Hiawatha Belt | 48,720,000 | 0 |
| 2010 S Hiawatha Belt | 0 | 1,689,216 |
| 2011 P Wampanoag Treaty | 29,400,000 | 0 |
| 2011 D Wampanoag Treaty | 48,160,000 | 0 |
| 2011 S Wampanoag Treaty | 0 | 1,673,010 |
| 2012 P 17th Century Trade Routes | 2,800,000 | 0 |
| 2012 D 17th Century Trade Routes | 3,080,000 | 0 |
| 2012 S 17th Century Trade Routes | 0 | 1,189,445 |
| 2013 P Delaware Treaty | 1,820,000 | 0 |
| 2013 D Delaware Treaty | 1,820,000 | 0 |
| 2013 S Delaware Treaty | 0 | 1,192,690 |
| 2014 P Native Hospitality | 3,080,000 | 0 |
| 2014 D Native Hospitality | 2,800,000 ( 50,000 Enhanced ) | 0 |
| 2014 S Native Hospitality | 0 | 1,144,190 |
| 2015 P Mohawk High Iron Workers | 2,800,000 | 0 |
| 2015 D Mohawk High Iron Workers | 2,240,000 | 0 |
| 2015 S Mohawk High Iron Workers | 0 | 1,050,394 |
| 2015 W Mohawk High Iron Workers | 88,805 (Enhanced) | 0 |
| 2016 P WW1/WW2 Code Talkers | 2,800,000 | 0 |
| 2016 D WW1/WW2 Code Talkers | 2,100,000 | 0 |
| 2016 S WW1/WW2 Code Talkers | 50,740 (Enhanced) | 965,093 |
| 2017 P Sequoyah | 1,820,000 | 0 |
| 2017 D Sequoyah | 1,540,000 | 0 |
| 2017 S Sequoyah | 223,310 (Enhanced) | 926,786 |
| 2018 P Jim Thorpe | 1,400,000 | 0 |
| 2018 D Jim Thorpe | 1,140,000 | 0 |
| 2018 S Jim Thorpe | 0 | 849,374 ( 199,177 Reverse ) |
| 2019 P American Indians in the Space Program | 1,400,000 ( 43,836 Enhanced ) | 0 |
| 2019 D American Indians in the Space Program | 1,540,000 | 0 |
| 2019 S American Indians in the Space Program | 0 | 1,027,462 |
| 2020 P Elizabeth Peratrovich / Alaska’s Anti-Discrimination Law | 1,400,000 | 0 |
| 2020 D Elizabeth Peratrovich / Alaska’s Anti-Discrimination Law | 1,260,000 | 0 |
| 2020 S Elizabeth Peratrovich / Alaska’s Anti-Discrimination Law | 0 | 1,101,282 |
| 2021 P American Indians in the U.S. Military | 1,260,000 | 0 |
| 2021 D American Indians in the U.S. Military | 1,260,000 | 0 |
| 2021 S American Indians in the U.S. Military | 0 | 778,264 |
| 2022 P Ely Samuel Parker | N/A | N/A |
| 2022 D Ely Samuel Parker | N/A | N/A |
| 2022 S Ely Samuel Parker | N/A | N/A |
| 2023 P Maria Tallchief and American Indians in Ballet | N/A | N/A |
| 2023 D Maria Tallchief and American Indians in Ballet | N/A | N/A |
| 2023 S Maria Tallchief and American Indians in Ballet | N/A | N/A |